This recipe has Sodium as 69.2% (as a percentage of RDA).
You may need to take this into account today to balance out your diet.
Nutrition Rating Details
Here are the percentages used to determine the nutritional rating for this recipe:
• Calcium: 2.2% of RDA
• Calories: 4.0% of RDA
• Carbs: 3.2% of RDA
• Fat (total lipid): 6.8% of RDA
• Fiber: 4.8% of RDA
• Fructose: 6.6% of RDA
• Protein: 2.7% of RDA
• Sodium: 69.2% of RDA
• Sugar: 18.0% of RDA
• Vitamin A (IU): 7.5% of RDA
• Vitamin B6: 10.9% of RDA
• Vitamin C: 20.2% of RDA
• Iron: 2.0% of RDA
• Magnesium: 5.8% of RDA
• Manganese: 6.4% of RDA
• Niacin: 5.3% of RDA
• Potassium: 8.7% of RDA
• Zinc: 3.3% of RDA
If any nutritional component is greater than 50% of RDA
(or any vitamin/mineral is greater than 400% of RDA),
the recipe gets a “Nutrition to Note” rating.
Whether this matters for your diet depends mostly on what other foods you consume today.
Please provide succinct feedback on why this substituion looks like it may not be correct.
E.g.:
It looks like a mistake.
It won't work for 99% of recipes.
Error: we need a reason for your feedback.
Thank you for the feedback! (We'll check it out...)
PREPARATION
1.
Sauté the olive oil, onion and garlic over medium heat for a couple of minutes.
2.
Add the pepper and the ginger and continue to stir.
3.
Add the zucchini and the chicken broth.
4.
Bring to a boil, then reduce heat to a simmer until zucchini is softened, 45 minutes or so.
5.
Using a Vitamix or immersion blender, puree the zucchini until the soup is creamy and smooth.
6.
Garnish with pepper, olive oil, cilantro or other seasonings of your choice.
THIS RECIPE CAN BE CUSTOMIZED
Make it Low Sodium!
A low-sodium variant of this recipe can be made that has a
91% reduction in the amount of sodium.
Just substitute low-sodium chicken broth for chicken broth.
COMPLETE NUTRITION
This recipe has the following nutrient totals:
Calories 80.8
Protein 3.08 g
Carbohydrates 8.93 g
Iron 0.38 mg
Fiber 1.35 g
Calcium 22.0 mg
(plus many more nutrients)
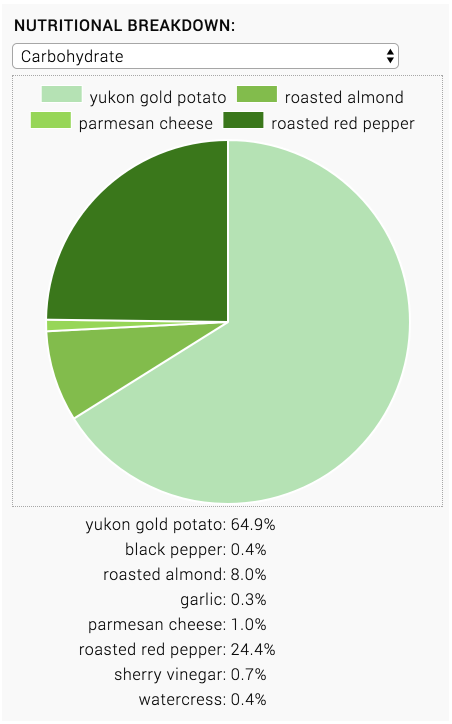
Sample Recipe Chart:
The sample chart shows the nutritional data that is typically shown for any given recipe.
The chart shows both nutrition totals as well as per-ingredient nutrition.