Here are the percentages used to determine the nutritional rating for this recipe:
• Calcium: 0.9% of RDA
• Calories: 16.1% of RDA
• Carbs: 9.2% of RDA
• Fat (total lipid): 14.3% of RDA
• Fiber: 8.0% of RDA
• Fructose: 7.3% of RDA
• Protein: 3.6% of RDA
• Sodium: 0.7% of RDA
• Sugar: 20.2% of RDA
• Vitamin A (IU): 17.0% of RDA
• Vitamin B6: 6.8% of RDA
• Vitamin C: 20.7% of RDA
• Iron: 4.6% of RDA
• Magnesium: 10.4% of RDA
• Manganese: 17.5% of RDA
• Niacin: 4.7% of RDA
• Potassium: 5.7% of RDA
• Zinc: 3.8% of RDA
If all nutritional components are less than 50% of RDA
(and all vitamins and minerals are less than 400% of RDA)
the recipe gets a “Bon Appétit” rating.
Please provide succinct feedback on why this substituion looks like it may not be correct.
E.g.:
It looks like a mistake.
It won't work for 99% of recipes.
Error: we need a reason for your feedback.
Thank you for the feedback! (We'll check it out...)
PREPARATION
PREPARING THE QUINOA
1.
Rinse the quinoa in a strainer several times with cold water.
2.
In a medium pot over medium-high heat, add 1 1/4 cups water and bring to a boil.
3.
Add the quinoa, cover, and turn off the heat. Allow the quinoa to steam until the water has been absorbed completely and the quinoa grains pop open, 10 to 15 minutes.
4.
Fluff with a fork. Set aside to cool.
PREPARING THE MANGO SALAD
5.
In a large mixing bowl, add the vinegar, mustard, garlic, shallot, 2 teaspoons salt and freshly ground black pepper.
6.
While pouring in a slow, steady stream, whisk in the olive oil until fully incorporated and lightly emulsified.
7.
Add the peppers, mango, cucumber, mint and quinoa. Toss to combine well.
ASSEMBLING THE BITES
8.
Scoop one small spoonful of the salad on each rice cracker. Serve immediately.
COMPLETE NUTRITION
This recipe has the following nutrient totals:
Calories 322
Protein 4.03 g
Carbohydrates 25.3 g
Iron 0.86 mg
Fiber 2.25 g
Calcium 8.67 mg
(plus many more nutrients)
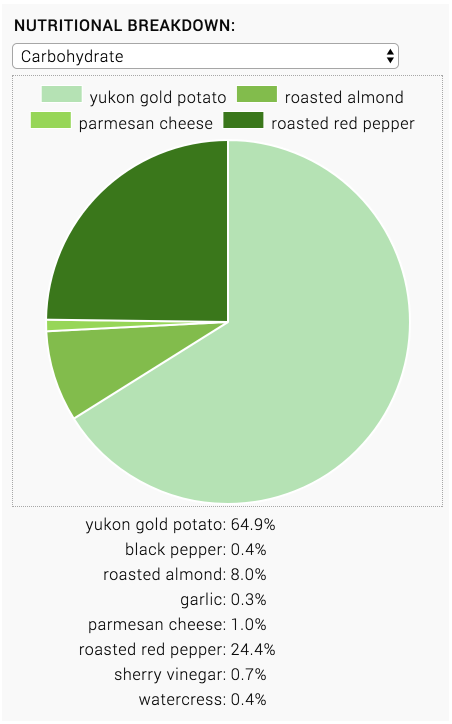
Sample Recipe Chart:
The sample chart shows the nutritional data that is typically shown for any given recipe.
The chart shows both nutrition totals as well as per-ingredient nutrition.