This recipe has Sodium as 143% (as a percentage of RDA).
You'll likely need to take this into account today to balance out your diet.
Nutrition Rating Details
Here are the percentages used to determine the nutritional rating for this recipe:
• Calcium: 0.6% of RDA
• Calories: 50.9% of RDA
• Carbs: 38.8% of RDA
• Fat (total lipid): 51.7% of RDA
• Fiber: 56.5% of RDA
• Fructose: 1.1% of RDA
• Protein: 59.8% of RDA
• Sodium: 143% of RDA
• Sugar: 36.2% of RDA
• Vitamin A (IU): 21.1% of RDA
• Vitamin B6: 49.2% of RDA
• Vitamin C: 10.2% of RDA
• Iron: 0.3% of RDA
• Magnesium: 63.3% of RDA
• Manganese: 31.7% of RDA
• Niacin: 57.2% of RDA
• Potassium: 42.1% of RDA
• Zinc: 64.3% of RDA
If any nutritional component is greater than 75% of RDA
(or any vitamin/mineral is greater than 600% of RDA),
the recipe gets a “Nutrition to Balance” rating.
Whether this matters for your diet depends mostly on what other foods you consume today.
Heat remaining oil in skillet over high heat. Add beef and stir fry for 3 minutes.
6.
Add onions and mung bean sprouts to the beef and stir-fry until onions are softening and the beef is cooked through.
7.
Add the egg noodles and then add prepared sauce. Cook until heated through and all ingredients are mixed well.
8.
Serve immediately topped with chopped scallion.
THIS RECIPE CAN BE CUSTOMIZED
1.
Make it Gluten Free!
A gluten-free variant of this recipe can be made.
Just make the following substutions: hoisin sauce (gluten-free) for hoisin sauce and gluten-free soy sauce for soy sauce (regular) and coconut aminos for soy sauce (regular).
2.
Make it Wheat Free!
A wheat-free variant of this recipe can be made.
Just make the following substutions: hoisin sauce (gluten-free) for hoisin sauce and gluten-free soy sauce for soy sauce (regular) and coconut aminos for soy sauce (regular).
COMPLETE NUTRITION
This recipe has the following nutrient totals:
Calories 1018
Protein 67.2 g
Carbohydrates 107 g
Iron 0.06 mg
Fiber 15.8 g
Calcium 6.17 mg
(plus many more nutrients)
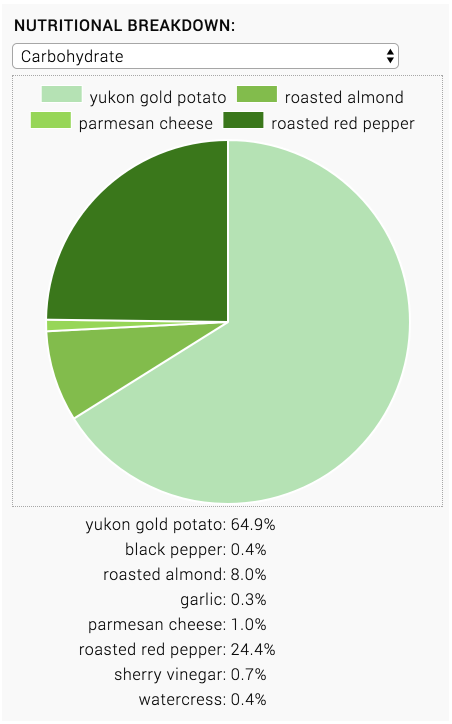
Sample Recipe Chart:
The sample chart shows the nutritional data that is typically shown for any given recipe.
The chart shows both nutrition totals as well as per-ingredient nutrition.